
Understand scans, leads, and conversions so you know which signs are working.
Who it's for
Owners and managers who want to measure performance across signs and communities.
How it helps
Real-time analytics show which properties and signs drive the most engagement, so you can focus effort where it pays off.
How to set it up
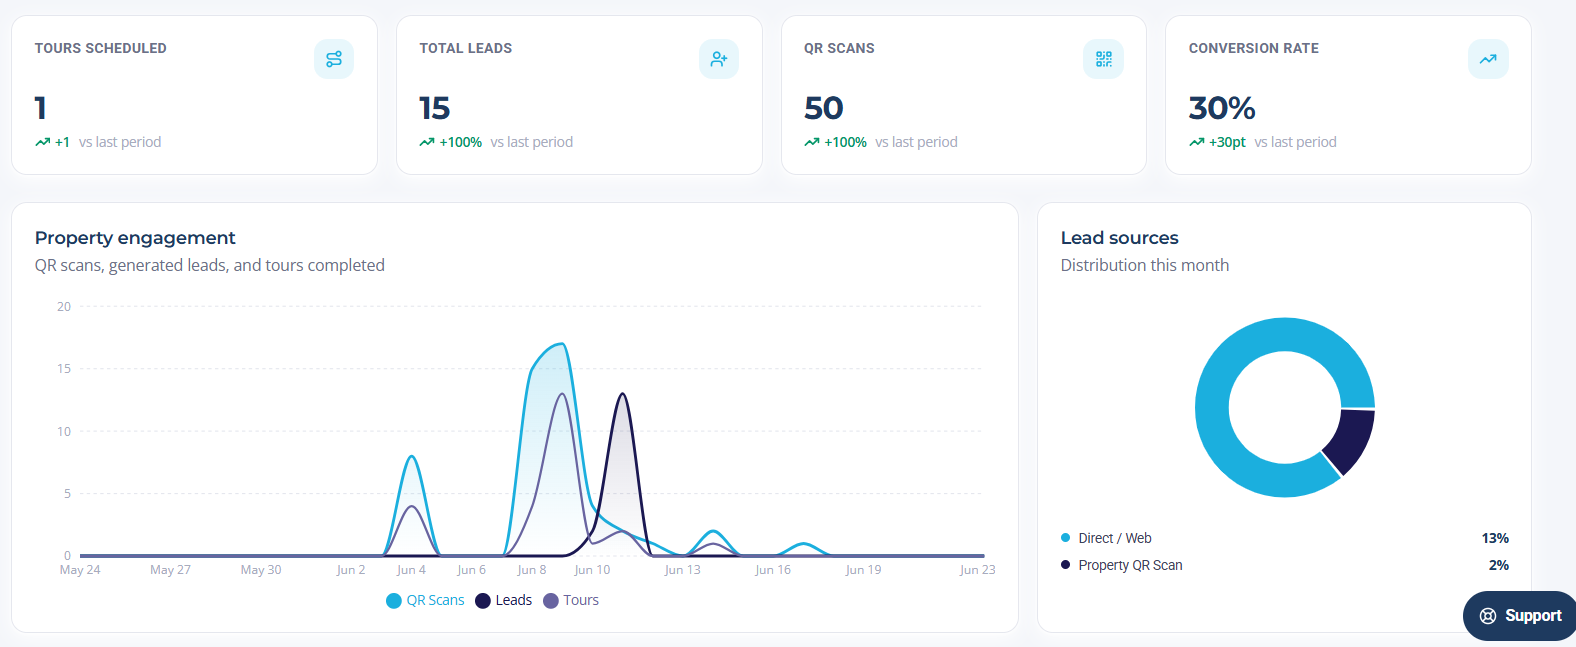
- 1Open Analytics to see your dashboards.
- 2Pick a date range to compare performance over time.
How to use it
- 1Track total scans, unique visitors, and conversion rates.
- 2Drill into per-sign performance to spot your top properties.
- 3Export reports to share with your team or stakeholders.